How to read Progression analytics
Last updated: October 9, 2026
Progression analytics shows where the accounts in an intent report are in their buying journey and how they move between stages week by week. Use it to see which accounts are heating up or cooling down, and whether your ABM programme moves them forward.
Before you start
You need an intent report. Progression analytics works best with a Buyer Journey intent report built on segments you are actively advertising to. If you are new to intent reports, read this article first.
Open Progression analytics
Go to Analytics > Progression analytics.
Select an intent report from the first dropdown. If you don't have one yet, click Create Buyer journey intent report at the bottom of the dropdown.
Optionally, use the CRM stage filter to focus on accounts in one CRM stage.
The page shows the buyer journey view, the opportunity analysis and an account list.
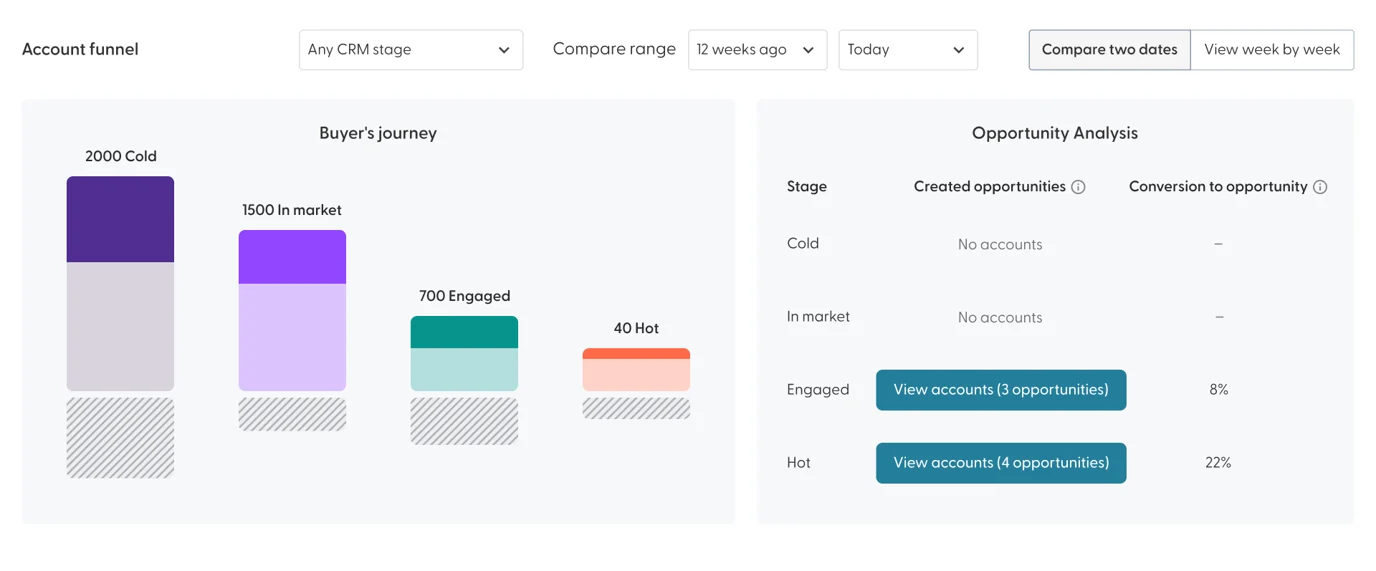
The buyer journey stages
Each account gets a stage based on its engagement score:
Stage | Score | What it means |
Cold | No score | No first-party or third-party signals. |
In Market | Up to 30 | Third-party intent only. The account is researching your topics but hasn't engaged with you yet. |
Engaged | 30 to 60 | The account has started engaging with you. |
Hot | 60 or more | Strong first-party engagement and the highest likelihood of converting. |
Engaged and Hot are driven by first-party engagement: your N.Rich ads, website visits and LinkedIn ad clicks. Prioritise Hot accounts for follow-up, and use the lower stages to decide where to build more awareness.
Use the buyer journey view
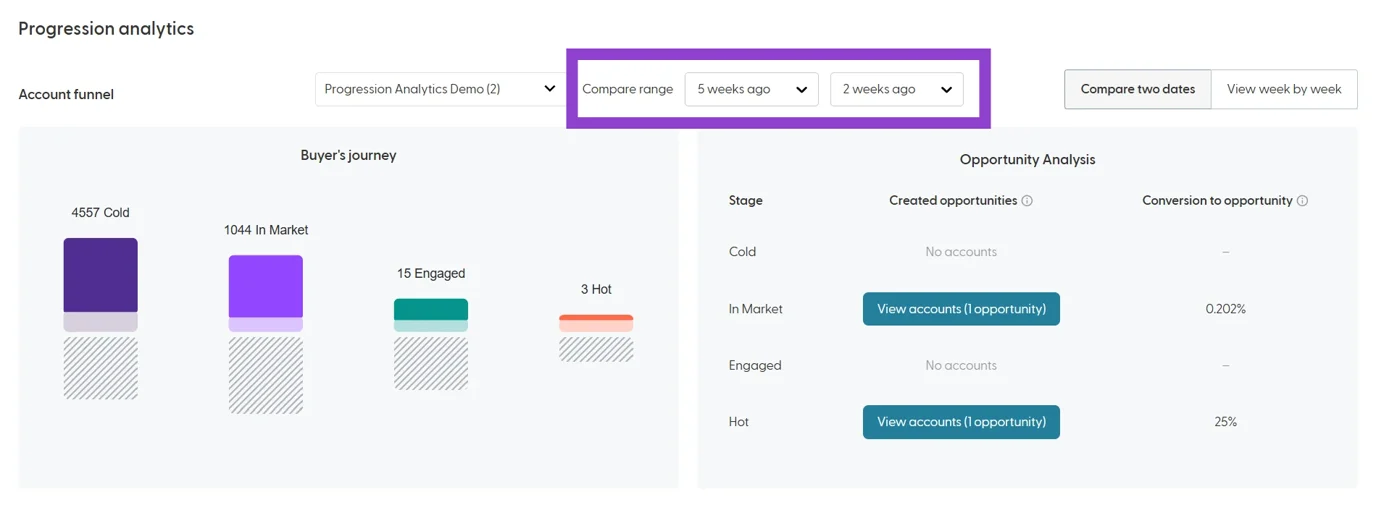
The Buyer's journey chart shows each stage and how accounts moved between stages in the selected time frame.
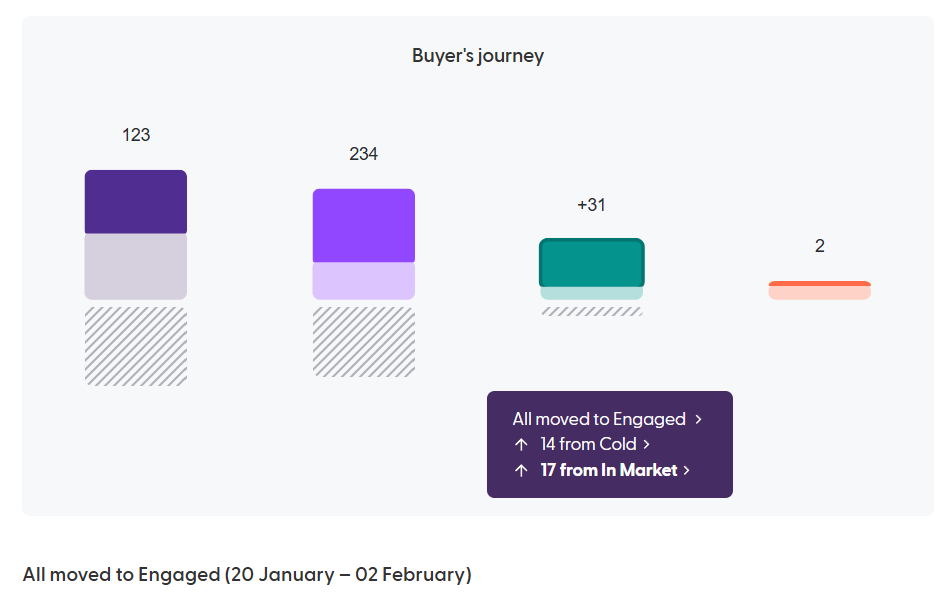
Light-coloured section (All accounts on this stage): all accounts in that stage during the time frame, whether they were already there or moved in.
Solid-coloured section: only the accounts that moved into the stage, from an earlier stage (progressed) or a later one (regressed). The tooltip shows how many came from each stage, and you can click through to the accounts.
Striped section at the bottom (Accounts left this stage): accounts that left the stage, to a later or an earlier stage.
When you click a section, the account list below updates and its title tells you which accounts you're looking at. The list shows each account's score, intent topics, competitive intent, first-party intent trend, intent locations, ICP sales velocity and CRM stage.
Use the opportunity analysis
For each stage, Opportunity Analysis shows:
Created opportunities: click View accounts to see the accounts in that stage with opportunities.
Conversion to opportunity: opportunities from accounts in the stage, divided by all accounts in the same stage that had sales engagements (logged calls, sent emails, email replies and meetings) in the last 90 days.
This needs your CRM connected to N.Rich, with opportunity and activity data syncing. If no sales activity is coming in from your CRM, the conversion column shows No Sales Engagements data.
Using the Journey Stage-Based Account Segmentation
Click Create Progression Workflow at the top of the page to create a segment for any journey stage (Cold, In Market, Engaged or Hot). The workflow keeps each segment in sync as accounts move between stages, so you can advertise to each stage differently. Once you've created one, the button changes to View Progression Workflow.

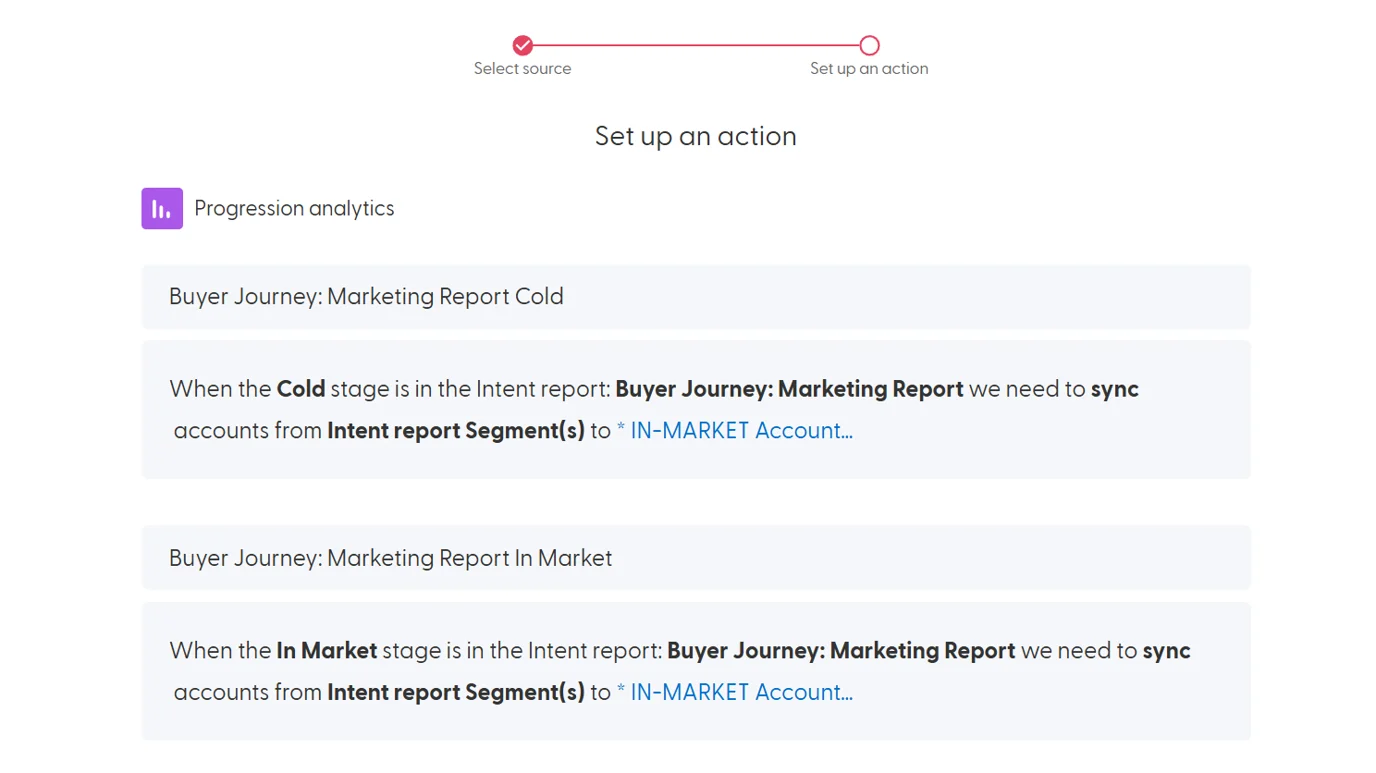
To learn more about workflows, see What are workflows and how do they work?
Use the weekly view
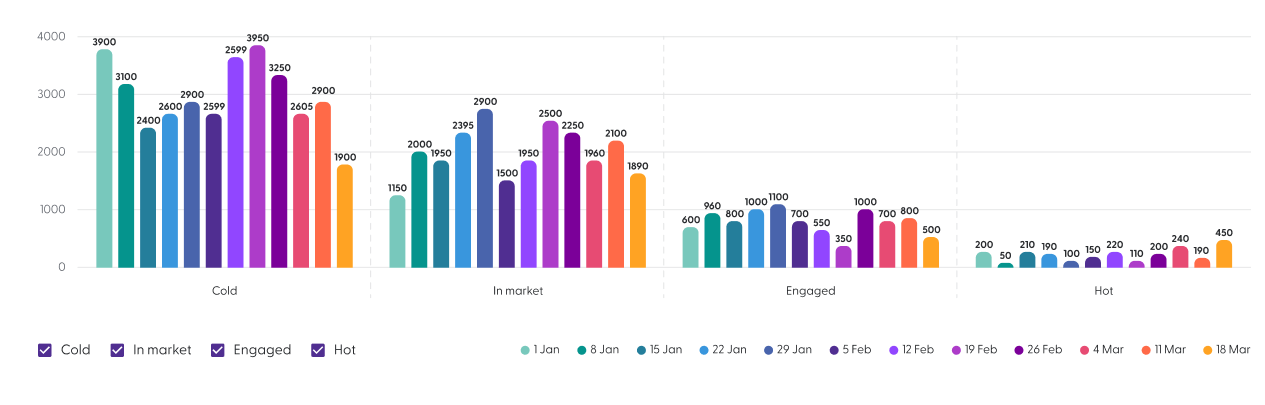
At the top right, switch from Compare two dates to View week by week.
The chart shows the number of accounts in each stage, week by week.
Use the stage selectors under the chart to show or hide stages, and the Compare range dropdowns to change the weeks.
Compare two date ranges
With Compare two dates selected, use the two Compare range dropdowns to pick the weeks to compare, for example 2 weeks ago and Last week. The first is the earlier week, the second is the base week you compare it against.
In the example below, last week is compared with 3 weeks ago: 5 accounts moved from Engaged to Hot.
Troubleshooting
No intent reports in the dropdown: create one with Create Buyer journey intent report.
No accounts in the buyer journey or weekly view: check that your intent report is set up correctly and is generating data.
Conversion to opportunity shows No Sales Engagements data: check that your CRM is connected and sales activity is syncing.
Scores look wrong or outdated: ask your Solutions Engineer to check your data sources.
What's next
Need help? Reach out to your Solutions Engineer via the chat in the bottom-left corner of the N.Rich platform, by email or Slack.