How to read the Sales Velocity dashboard
Last updated: October 9, 2026
The Sales Velocity dashboard shows how your ABM programme affects deal size, win rate and sales cycle length. Use it to report ABM impact on revenue to sales and leadership.
Before you start
Your CRM must be connected to N.Rich, with opportunity data syncing. See How to connect HubSpot to N.Rich or How to connect Salesforce to N.Rich.
Go to Analytics > Sales velocity.
The four influence groups
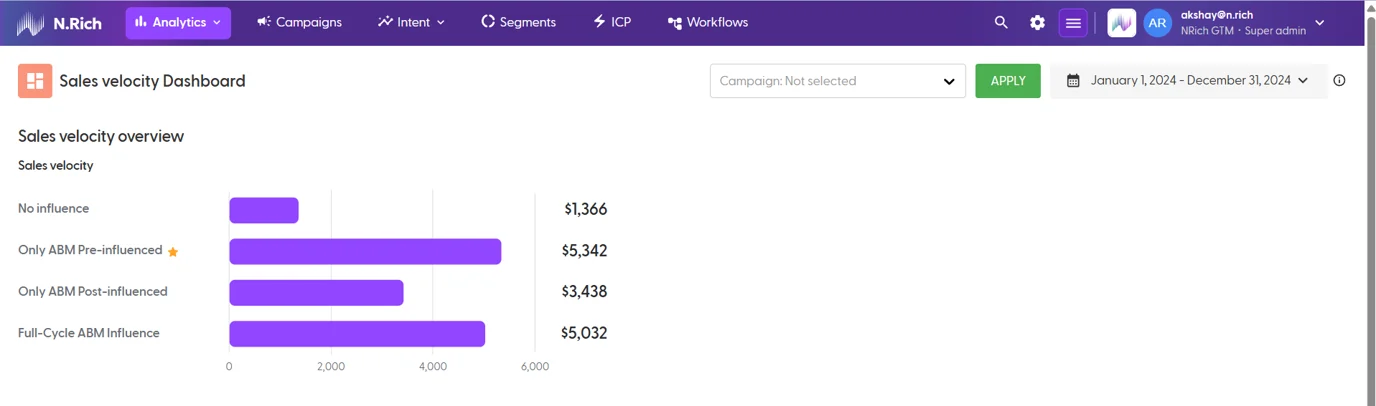
The dashboard sorts your opportunities into four groups (see how N.Rich decides an opportunity was influenced):
ABM Pre-influenced: ad engagement only before the opportunity was created.
ABM Post-influenced: ad engagement only after the opportunity was created.
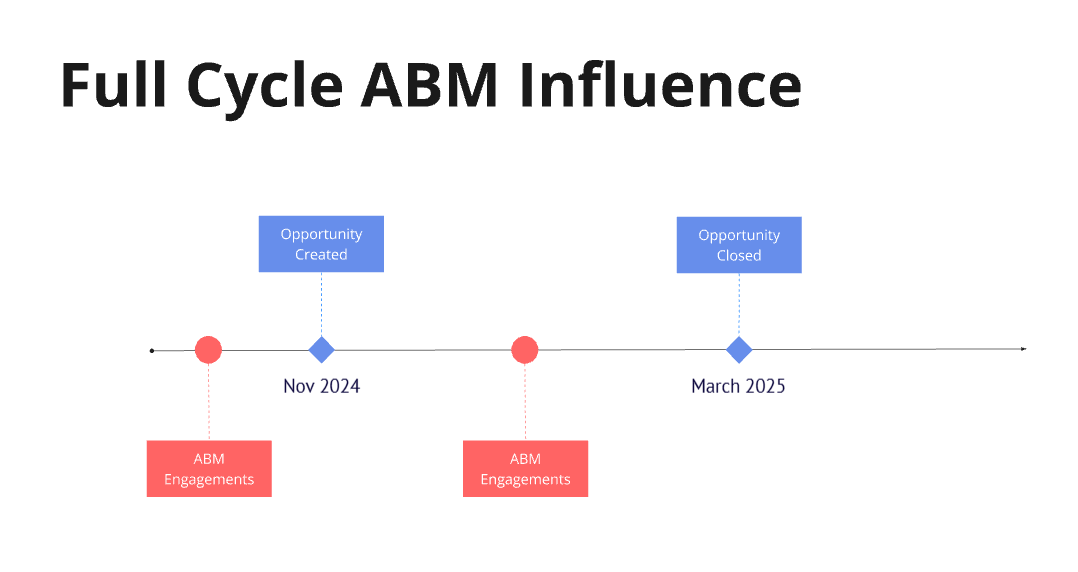
Full-Cycle ABM Influence: ad engagement both before and after the opportunity was created.
No influence: no ABM ad engagement.
How sales velocity is calculated
N.Rich uses realized monthly sales velocity: how fast a group of opportunities actually turned into revenue. It looks back at real bookings, so it suits retrospective reporting and comparing groups, not forecasting.
average deal size x average win rate / (average sales cycle / 30)
Average deal size: the average deal value in the group.
Average win rate: the share of opportunities that became Closed Won.
Average sales cycle (in days): the average time it takes to close a deal.
What the dashboard shows
Overview: the sales velocity of each of the four groups, so you can see which one generates revenue fastest. In a mature ABM programme, the influenced groups usually have a clearly higher sales velocity.
Sales velocity breakdown: average deal size, average win rate and average sales cycle (in days) for each group, showing which metric ABM improves and at which point in the buyer journey.
Opportunities table: how many opportunities in each stage fall into each group, so you can see how much of your pipeline ABM covers.
Filters
Date range: pick the period at the top of the page.
Filter by: choose Engagements date to look at opportunities from accounts that engaged with ABM ads in the selected period, or Opportunity close date to look at opportunities closed in the selected period (won or lost), plus those still open during it.
Campaign: only engagements from the selected campaigns count towards the influenced groups. Click Apply to update the dashboard, or Reset to clear the filter.
Use Export at the top right to download the data.
What's next
How to read Opportunity analytics, to see which individual opportunities were influenced
Need help? Reach out to your Solutions Engineer via the chat in the bottom-left corner of the N.Rich platform, by email or Slack.